CI/CD DevOps Pipeline Project: Deployment of Java Application on Kubernetes
1. Introduction
In the rapidly evolving landscape of software development, adopting DevOps practices has become essential for organizations aiming for agility, efficiency, and quality in their software delivery processes. This project focuses on implementing a robust DevOps Continuous Integration/Continuous Deployment (CI/CD) pipeline, orchestrated by Jenkins, to streamline the development, testing, and deployment phases of a Java-based software product onto a Kubernetes cluster.
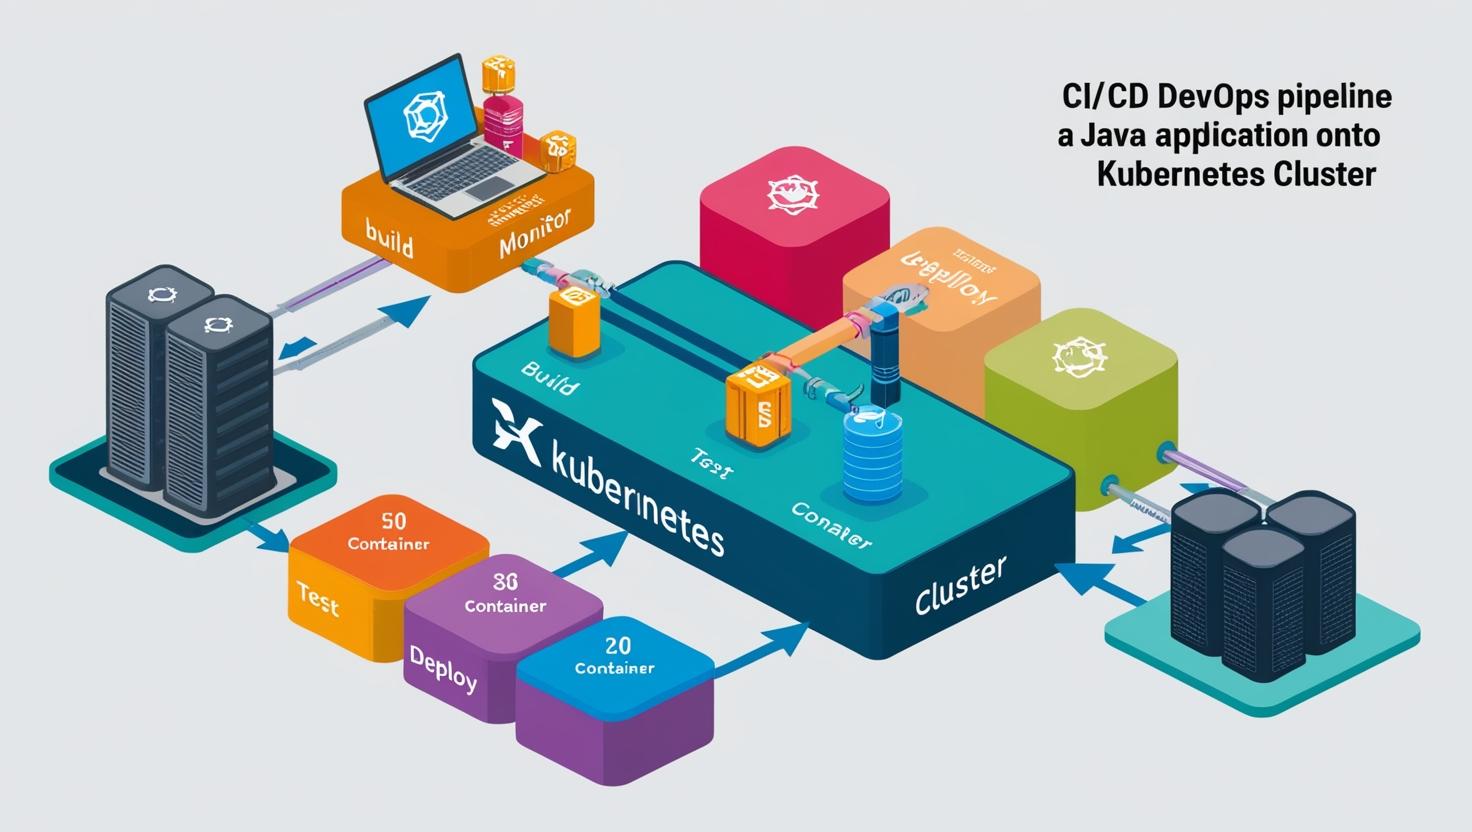
2. Architecture
The architecture consists of the following key components and flows:
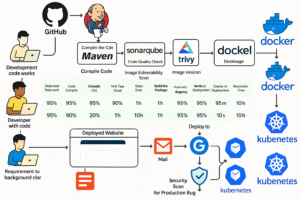
Version Control: Developers commit code changes to a private Git repository (e.g., GitHub, GitLab).
CI/CD Orchestration: Jenkins monitors the Git repository for changes. Upon detecting a change, it triggers the CI/CD pipeline.
Build & Unit Test: Jenkins checks out the code and uses Maven to compile the Java application and run unit tests.
Code Analysis: SonarQube performs static code analysis to identify bugs, vulnerabilities, and code smells. Jenkins uses the SonarQube Scanner plugin to integrate this step. The pipeline includes a Quality Gate check to ensure code quality standards are met.
Security Scanning (FS): Trivy scans the project filesystem for known vulnerabilities in dependencies before packaging.
Artifact Management: Maven packages the application (e.g., into a JAR or WAR file) and deploys the artifact to Nexus Repository Manager.
Containerization: Jenkins builds a Docker image containing the application artifact using a Dockerfile.
Security Scanning (Image): Trivy scans the built Docker image for operating system and application dependency vulnerabilities.
Image Registry: The validated Docker image is pushed to a Docker registry (e.g., Docker Hub, or a private registry hosted on Nexus).
Deployment: Jenkins uses the Kubernetes CLI plugin (kubectl) to apply deployment configurations (YAML files) to the Kubernetes cluster, deploying or updating the application.
Kubernetes Cluster: The cluster (managed by Kubeadm) runs the containerized application, handling scheduling, scaling, and service discovery. It consists of a Master Node and multiple Worker Nodes.
Monitoring:
Prometheus: Scrapes metrics from Kubernetes nodes (via Node Exporter, not explicitly mentioned but typically used), Kubernetes components, and potentially the application itself. It also uses Blackbox Exporter to probe application endpoints.
Grafana: Connects to Prometheus as a data source to visualize metrics and create dashboards for monitoring cluster and application health.
Notification: Jenkins sends email notifications (via Gmail integration) about the pipeline status (success or failure) to relevant stakeholders.
3. Purpose and Objectives
The primary purpose of this project is to automate the software delivery lifecycle, from code compilation to deployment, thereby accelerating time-to-market, enhancing product quality, and reducing manual errors. The key objectives include:
Establishing a seamless CI/CD pipeline using Jenkins to automate various stages of the software delivery process.
Integrating essential DevOps tools such as Maven, SonarQube, Trivy, Nexus Repository, Docker, Kubernetes, Prometheus, and Grafana to ensure comprehensive automation and monitoring.
Improving code quality through static code analysis and vulnerability scanning.
Ensuring reliable and consistent deployments on a Kubernetes cluster with proper load balancing.
Facilitating timely notifications and alerts via email integration for efficient communication and incident management.
Implementing robust monitoring and alerting mechanisms to track system health and performance.
4. Tools Used
Jenkins: Automation orchestration for CI/CD pipeline.
Maven: Build automation and dependency management for Java projects.
SonarQube: Static code analysis for code quality and security assurance.
Trivy: Vulnerability scanning for filesystems and Docker images.
Nexus Repository: Artifact management (JARs, WARs) and Docker image hosting.
Docker: Containerization for packaging applications and dependencies.
Kubernetes (Kubeadm): Container orchestration for deployment, scaling, and management.
Git: Distributed version control system.
Gmail Integration (Jenkins Email Extension Plugin): Email notifications for pipeline status.
Prometheus: Time-series database and monitoring system for collecting metrics.
Grafana: Visualization platform for creating monitoring dashboards.
AWS (EC2): Cloud platform for provisioning virtual machines (infrastructure).
Calico: Network plugin for Kubernetes networking and security policies.
CRI-O: Container Runtime Interface implementation for Kubernetes.
Segment 1: Infrastructure Setup (AWS & Kubernetes)
5.1 Setting up Virtual Machines on AWS
To establish the infrastructure required for the DevOps tools setup, virtual machines were provisioned on the Amazon Web Services (AWS) platform using EC2 instances. Each virtual machine served a specific purpose in the CI/CD pipeline.
5.2 EC2 Instances Overview
Kubernetes Master Node (1): Manages the Kubernetes cluster state, API server, scheduler, etc. (Recommended: t2.medium or higher).
Kubernetes Worker Nodes (2): Run the application pods and workloads scheduled by the master. (Recommended: t2.medium or higher).
SonarQube Server (1): Hosts the SonarQube application for code analysis. (Recommended: t2.medium or higher, depending on analysis load).
Nexus Repository Manager (1): Hosts Nexus for artifact and Docker image storage. (Recommended: t2.medium or higher, with sufficient disk space).
Jenkins Server (1): Orchestrates the CI/CD pipeline. (Recommended: t2.medium or higher).
Monitoring Server (1): Hosts Prometheus and Grafana. (Recommended: t2.medium or higher).

Note: For production environments, instance types, disk sizes, and redundancy (e.g., multiple master nodes) should be chosen based on expected load and availability requirements.
5.3 Security Group Configuration
A single AWS Security Group was used for all instances to simplify network communication between them. The following inbound rules are essential (adjust source IPs/ranges for security):
| Port Range | Protocol | Source | Description |
| 22 | TCP | Your IP | SSH access for administration |
| 8080 | TCP | Your IP | Jenkins UI |
| 9000 | TCP | Your IP | SonarQube UI |
| 8081 | TCP | Your IP | Nexus Repository Manager UI |
| 3000 | TCP | Your IP | Grafana UI |
| 9090 | TCP | Your IP | Prometheus UI |
| 9115 | TCP | Your IP | Blackbox Exporter (if accessed directly) |
| 6443 | TCP | SG Internal* | Kubernetes API Server (Master to Workers, etc.) |
| 10250 | TCP | SG Internal* | Kubelet API (Master to Workers) |
| 2379-2380 | TCP | SG Internal* | etcd server client API (Master nodes) |
| 10257 | TCP | SG Internal* | Kube-controller-manager |
| 10259 | TCP | SG Internal* | Kube-scheduler |
| 30000-32767 | TCP | 0.0.0.0/0 | Kubernetes NodePort range (for application access) |
| All Traffic | All | SG Internal* | Allow all communication within the Security Group |

* SG Internal refers to the Security Group ID itself, allowing instances within the group to communicate freely. For enhanced security, restrict rules further based on specific source/destination instance needs.
5.4 Set Up Kubernetes Cluster Using Kubeadm
This section details the steps to create a multi-node Kubernetes cluster using kubeadm.
5.4.1 Prerequisites
Ubuntu OS (Xenial or later) on all Kubernetes nodes.
Sudo privileges on all nodes.
Internet access on all nodes.
Recommended instance type: t2.medium or higher.
All Kubernetes nodes (Master, Worker 1, Worker 2) must be in the same AWS Security Group configured as above.
5.4.2 AWS Security Group Adjustment
Ensure port 6443 is open within the Security Group (or from Worker node IPs to the Master node IP) to allow worker nodes to join the cluster API server.
5.4.3 Common Steps (Execute on BOTH Master & ALL Worker Nodes)
Prepare each node for Kubernetes installation.
# 1. Disable swap (required by kubelet)
sudo swapoff -a
# Optional: Persist swap off by commenting out the swap line in /etc/fstab
# sudo sed -i '/ swap / s/^\(.*\)$/#\1/g' /etc/fstab

# 2. Load required kernel modules
cat <<EOF | sudo tee /etc/modules-load.d/k8s.conf
overlay
br_netfilter
EOF

sudo modprobe overlay
sudo modprobe br_netfilter

# 3. Set sysctl parameters required by Kubernetes networking
cat <<EOF | sudo tee /etc/sysctl.d/k8s.conf
net.bridge.bridge-nf-call-iptables = 1
net.bridge.bridge-nf-call-ip6tables = 1
net.ipv4.ip_forward = 1
EOF

# Apply sysctl parameters without reboot
sudo sysctl --system
5.4.4 Install CRI-O Runtime
Install the Container Runtime Interface (CRI-O).
# Update package list and install prerequisites
sudo apt-get update -y
sudo apt-get install -y software-properties-common curl apt-transport-https ca-certificates gpg

# Add CRI-O GPG key
sudo curl -fsSL https://pkgs.k8s.io/addons:/crio:/prerelease:/main/deb/Release.key | sudo gpg --dearmor -o /etc/apt/keyrings/cri-o-apt-keyring.gpg

# Add CRI-O repository
echo "deb [signed-by=/etc/apt/keyrings/cri-o-apt-keyring.gpg] https://pkgs.k8s.io/addons:/cri-o:/prerelease:/main/deb/ /" | sudo tee /etc/apt/sources.list.d/cri-o.list

# Update package list again and install CRI-O
sudo apt-get update -y
sudo apt-get install -y cri-o

# Reload systemd, enable and start CRI-O service
sudo systemctl daemon-reload
sudo systemctl enable crio --now
sudo systemctl start crio.service

echo "CRI runtime installed successfully"
5.4.5 Install Kubernetes Packages
Install kubelet, kubeadm, and kubectl.
# Add Kubernetes GPG key
curl -fsSL https://pkgs.k8s.io/core:/stable:/v1.29/deb/Release.key | sudo gpg --dearmor -o /etc/apt/keyrings/kubernetes-apt-keyring.gpg

# Add Kubernetes repository
echo 'deb [signed-by=/etc/apt/keyrings/kubernetes-apt-keyring.gpg] https://pkgs.k8s.io/core:/stable:/v1.29/deb/ /' | sudo tee /etc/apt/sources.list.d/kubernetes.list

# Update package list and install Kubernetes tools (specific version)
sudo apt-get update -y
sudo apt-get install -y kubelet="1.29.0-*" kubectl="1.29.0-*" kubeadm="1.29.0-*"

# Optionally install jq (useful for JSON parsing)
sudo apt-get update -y
sudo apt-get install -y jq

# Enable and start kubelet service
sudo systemctl enable --now kubelet
sudo systemctl start kubelet

# Prevent Kubernetes packages from being automatically updated
sudo apt-mark hold kubelet kubeadm kubectl
5.4.6 Master Node Setup (Execute ONLY on Master)
Initialize the Kubernetes control plane.
# Pull required container images
sudo kubeadm config images pull --cri-socket unix:///var/run/crio/crio.sock

# Initialize the cluster (replace <MASTER_IP> if needed, often auto-detected)
# Use --pod-network-cidr=192.168.0.0/16 if using Calico (check Calico docs for current CIDR)
sudo kubeadm init --pod-network-cidr=192.168.0.0/16 --cri-socket unix:///var/run/crio/crio.sock

# Set up kubectl for the regular user
mkdir -p "$HOME"/.kube
sudo cp -i /etc/kubernetes/admin.conf "$HOME"/.kube/config
sudo chown "$(id -u)":"$(id -g)" "$HOME"/.kube/config

# Verify kubectl access
kubectl get nodes
Take note of the kubeadm join command output by the kubeadm init step. You will need this for the worker nodes.
5.4.7 Network Plugin Installation (Calico)
Apply the Calico network plugin manifest on the Master node.
# Apply Calico network plugin manifest
kubectl apply -f https://raw.githubusercontent.com/projectcalico/calico/v3.26.0/manifests/calico.yaml
Wait a few minutes for the Calico pods to start (kubectl get pods -n kube-system).
5.4.8 Worker Node Setup (Execute on ALL Worker Nodes)
Join the worker nodes to the cluster.
# Reset any previous kubeadm installations (if necessary)
# sudo kubeadm reset pre-flight checks # Typo in original, should likely be:
# sudo kubeadm reset --force           # Use with caution!

# Paste the 'kubeadm join' command obtained from the master node init step.
# Append --v=5 for verbose logging during join.
# Example:
# sudo kubeadm join <MASTER_IP>:6443 --token <TOKEN> --discovery-token-ca-cert-hash sha256:<HASH> --cri-socket unix:///var/run/crio/crio.sock --v=5
sudo <paste-your-join-command-here> --v=5
5.4.9 Verify Cluster Connection (on Master Node)
Check if all nodes have joined and are in the Ready state.
kubectl get nodes -o wideYou should see the master node and all worker nodes listed. It might take a minute or two for them to become Ready.
Segment 2: Tool Installation & Configuration
6.1 Jenkins Server Setup
Execute these commands on the dedicated Jenkins VM.
#!/bin/bash

# Install OpenJDK 17 (Required by recent Jenkins versions)
sudo apt-get update
sudo apt-get install openjdk-17-jre-headless -y

# Add Jenkins repository key
sudo wget -O /usr/share/keyrings/jenkins-keyring.asc \
  https://pkg.jenkins.io/debian-stable/jenkins.io-2023.key

# Add Jenkins repository to sources
echo deb [signed-by=/usr/share/keyrings/jenkins-keyring.asc] \
  https://pkg.jenkins.io/debian-stable binary/ | sudo tee \
  /etc/apt/sources.list.d/jenkins.list > /dev/null

# Update package list and install Jenkins
sudo apt-get update
sudo apt-get install jenkins -y

# Start and enable Jenkins service (usually starts automatically)
# sudo systemctl start jenkins
# sudo systemctl enable jenkins
# sudo systemctl status jenkins

# Install kubectl on Jenkins server for pipeline interaction
curl -o kubectl https://s3.us-west-2.amazonaws.com/amazon-eks/1.29.0/2024-01-04/bin/linux/amd64/kubectl
# Or use: curl -LO "https://dl.k8s.io/release/$(curl -L -s https://dl.k8s.io/release/stable.txt)/bin/linux/amd64/kubectl"

chmod +x ./kubectl
sudo mv ./kubectl /usr/local/bin/kubectl
kubectl version --client

# Install Docker on Jenkins server
sudo apt-get update
sudo apt-get install -y ca-certificates curl
sudo install -m 0755 -d /etc/apt/keyrings
sudo curl -fsSL https://download.docker.com/linux/ubuntu/gpg -o /etc/apt/keyrings/docker.asc
sudo chmod a+r /etc/apt/keyrings/docker.asc

echo \
  "deb [arch=$(dpkg --print-architecture) signed-by=/etc/apt/keyrings/docker.asc] https://download.docker.com/linux/ubuntu \
  $(. /etc/os-release && echo "$VERSION_CODENAME") stable" | \
  sudo tee /etc/apt/sources.list.d/docker.list > /dev/null
sudo apt-get update

sudo apt-get install -y docker-ce docker-ce-cli containerd.io docker-buildx-plugin docker-compose-plugin

# Add jenkins user to the docker group
sudo usermod -aG docker jenkins

# Apply group changes (either reboot or run 'newgrp docker' in jenkins user context, or restart Jenkins)
sudo systemctl restart jenkins

echo "Jenkins installation complete. Access at http://<Jenkins_VM_IP>:8080"
echo "Initial admin password:"
sudo cat /var/lib/jenkins/secrets/initialAdminPassword
Follow the on-screen instructions in the Jenkins UI to complete the setup (unlock, install suggested plugins, create admin user).
6.2 Nexus Repository Manager Setup
Execute these commands on the dedicated Nexus VM.
#!/bin/bash

# Install Docker (similar steps as for Jenkins)
sudo apt-get update
sudo apt-get install -y ca-certificates curl
sudo install -m 0755 -d /etc/apt/keyrings
sudo curl -fsSL https://download.docker.com/linux/ubuntu/gpg -o /etc/apt/keyrings/docker.asc
sudo chmod a+r /etc/apt/keyrings/docker.asc

echo \
  "deb [arch=$(dpkg --print-architecture) signed-by=/etc/apt/keyrings/docker.asc] https://download.docker.com/linux/ubuntu \
  $(. /etc/os-release && echo "$VERSION_CODENAME") stable" | \
  sudo tee /etc/apt/sources.list.d/docker.list > /dev/null
sudo apt-get update

sudo apt-get install -y docker-ce docker-ce-cli containerd.io docker-buildx-plugin docker-compose-plugin

# Persist Nexus data using a Docker volume (Recommended)
docker volume create --name nexus-data

# Run Nexus 3 using Docker container
docker run -d --name nexus -p 8081:8081 -v nexus-data:/nexus-data sonatype/nexus3:latest

echo "Nexus container started. Access at http://<Nexus_VM_IP>:8081"
echo "It might take a few minutes for Nexus to start fully."
Get Nexus Initial Admin Password:
Find the Nexus container ID: docker ps
Execute into the container: docker exec -it <container_ID> /bin/bash
Navigate to the data directory: cd /nexus-data (or sonatype-work/nexus3 if not using a volume mapped to /nexus-data)
View the initial password: cat admin.password
Exit the container: exit
Access Nexus at http://<Nexus_VM_IP>:8081, log in as admin with the retrieved password, and complete the setup wizard (change password, configure anonymous access). You will likely need to configure:
A Maven Hosted Repository (e.g., my-releases) for deploying your application artifacts.
A Maven Proxy Repository (e.g., maven-central) to proxy Maven Central.
A Maven Group Repository (e.g., maven-public) grouping the hosted and proxy repositories.
A Docker Hosted Repository (e.g., my-docker-hosted on port 5000) to push your application images. Configure the HTTP connector for this port.
6.3 SonarQube Server Setup
Execute these commands on the dedicated SonarQube VM.
#!/bin/bash

# Install Docker (similar steps as above)
sudo apt-get update
sudo apt-get install -y ca-certificates curl
sudo install -m 0755 -d /etc/apt/keyrings
sudo curl -fsSL https://download.docker.com/linux/ubuntu/gpg -o /etc/apt/keyrings/docker.asc
sudo chmod a+r /etc/apt/keyrings/docker.asc

echo \
  "deb [arch=$(dpkg --print-architecture) signed-by=/etc/apt/keyrings/docker.asc] https://download.docker.com/linux/ubuntu \
  $(. /etc/os-release && echo "$VERSION_CODENAME") stable" | \
  sudo tee /etc/apt/sources.list.d/docker.list > /dev/null
sudo apt-get update

sudo apt-get install -y docker-ce docker-ce-cli containerd.io docker-buildx-plugin docker-compose-plugin

# Increase virtual memory for Elasticsearch (required by SonarQube)
# This needs to be done on the HOST running the container
sudo sysctl -w vm.max_map_count=262144
sudo sysctl -w fs.file-max=65536
# To make these changes persistent, add them to /etc/sysctl.conf and run 'sudo sysctl -p'

# Create Docker volumes for SonarQube data persistence (Recommended)
docker volume create --name sonarqube_data
docker volume create --name sonarqube_logs
docker volume create --name sonarqube_extensions

# Run SonarQube LTS Community Edition using Docker
docker run -d --name sonar \
    -p 9000:9000 \
    -e sonar.jdbc.username=sonar \
    -e sonar.jdbc.password=sonar \
    -e sonar.jdbc.url=jdbc:postgresql://localhost/sonar \ # Example if using external DB
    -v sonarqube_data:/opt/sonarqube/data \
    -v sonarqube_logs:/opt/sonarqube/logs \
    -v sonarqube_extensions:/opt/sonarqube/extensions \
    sonarqube:lts-community

echo "SonarQube container started. Access at http://<SonarQube_VM_IP>:9000"
echo "It might take a few minutes for SonarQube to start fully."
Note: The provided docker run command uses the embedded H2 database, suitable only for evaluation. For production, configure an external database (PostgreSQL recommended) and update the JDBC environment variables.
Access SonarQube at http://<SonarQube_VM_IP>:9000. The default admin credentials are admin/admin. You will be prompted to change the password on first login. Generate an authentication token (Administration -> Security -> Users -> Tokens) for Jenkins to use.
Segment 3: Version Control Setup
7.1 Private Git Repository Setup
Create Repository: Navigate to your chosen Git hosting platform (GitHub, GitLab, Bitbucket). Create a new repository, ensuring you select the “Private” option.
Generate Personal Access Token (PAT):
Go to your account settings on the Git platform.
Find the section for “Developer settings” or “Personal access tokens”.
Generate a new token. Give it a descriptive name (e.g., jenkins-ci-cd).
Grant the necessary scopes/permissions. For cloning and pushing, repo (GitHub) or read_repository, write_repository (GitLab) scopes are typically required.
Important: Copy the generated token immediately. You won’t be able to see it again. Store it securely (e.g., in a password manager).
7.2 Code Management Workflow
Clone Repository: On your local development machine (or wherever the code resides), open a terminal or Git client.
git clone <repository_URL>
# Example: git clone https://github.com/your-username/your-private-repo.git
cd your-private-repo
Add Code: Place your Java application source code, pom.xml, Dockerfile, and Kubernetes manifests (deployment-service.yaml) into this directory.
Stage Changes:
git add .Commit Changes:
git commit -m "Initial project setup with Java app and CI/CD files"Push Changes:
git push -u origin main # Or master, depending on your default branch nameAuthentication: When prompted for username/password:
Username: Enter your Git hosting platform username (e.g., GitHub username).
Password: Paste the Personal Access Token (PAT) you generated earlier. Do not use your regular account password.
Your code is now securely stored in the private repository, ready for Jenkins to access.
Segment 4: CI/CD Pipeline Implementation
8.1 Jenkins Plugin Installation
Install the following plugins via Jenkins -> Manage Jenkins -> Manage Plugins -> Available tab:
Eclipse Temurin Installer: To install JDKs automatically.
Pipeline Maven Integration: Provides Maven build steps for Pipeline.
Config File Provider: Manage configuration files like settings.xml centrally.
SonarQube Scanner: Integrate Jenkins with SonarQube for analysis.
Kubernetes CLI: Provides kubectl command access within Pipeline.
Kubernetes: Allows running Jenkins agents as pods in Kubernetes (optional for this specific pipeline but good practice).
Docker: Provides Docker integration capabilities.
Docker Pipeline: Offers declarative Pipeline steps for Docker (withDockerRegistry, etc.).
Email Extension Plugin: For enhanced email notifications (emailext).
Install them by searching for the names and clicking “Install without restart” or “Download now and install after restart”.
8.2 Jenkins Configuration (Prerequisites)
Before running the pipeline, configure the following in Jenkins:
Global Tool Configuration (Manage Jenkins -> Global Tool Configuration):
JDK: Add a JDK installation (e.g., JDK 17) using the “Eclipse Temurin” installer. Name it jdk17 (matching the pipeline).
Maven: Add a Maven installation (e.g., Maven 3.x). Name it maven3 (matching the pipeline).
SonarQube Scanner: Add a SonarQube Scanner installation. Name it sonar-scanner (matching the pipeline).
Docker: Add a Docker installation (if needed, often uses host’s Docker). Name it docker (matching the pipeline).
Configure System (Manage Jenkins -> Configure System):
SonarQube Servers: Add your SonarQube server instance.
Name: sonar (matching the pipeline).
Server URL: http://<SonarQube_VM_IP>:9000.
Server authentication token: Add a ‘Secret text’ credential (see step 3) containing the SonarQube token you generated.
Credentials (Manage Jenkins -> Credentials -> System -> Global credentials):
Git Credentials: Add Username with password credential.
Username: Your Git username.
Password: Your Git Personal Access Token (PAT).
ID: git-cred (matching the pipeline).
SonarQube Token: Add Secret text credential.
Secret: Paste the SonarQube authentication token.
ID: sonar-token (matching the pipeline waitForQualityGate step).
Docker Hub Credentials: Add Username with password credential.
Username: Your Docker Hub username.
Password: Your Docker Hub password or Access Token.
ID: docker-cred (matching the pipeline).
Kubernetes Config: Add Secret file credential.
File: Upload your Kubernetes config file ($HOME/.kube/config from the Master node).
ID: k8-cred (matching the pipeline).
Nexus Credentials (Optional but Recommended): If your Nexus requires authentication for deployment, add Username with password credentials.
ID: e.g., nexus-creds.
Managed Files (Manage Jenkins -> Managed files – Requires Config File Provider plugin):
Add a Maven settings.xml file (global-settings.xml).
ID: global-settings (matching the pipeline withMaven step).
Content: Configure your Nexus repository URLs and credentials (using the nexus-creds ID if created). Example snippet:
<settings xmlns="http://maven.apache.org/SETTINGS/1.0.0"
  xmlns:xsi="http://www.w3.org/2001/XMLSchema-instance"
  xsi:schemaLocation="http://maven.apache.org/SETTINGS/1.0.0
                      https://maven.apache.org/xsd/settings-1.0.0.xsd">

  <servers>
    <server>
      <id>nexus</id> <!-- This ID must match the repository ID in your pom.xml -->
      <username>${env.NEXUS_USER}</username> <!-- Or use Jenkins credentials binding -->
      <password>${env.NEXUS_PASS}</password>
    </server>
  </servers>

  <profiles>
    <profile>
      <id>nexus</id>
      <repositories>
        <repository>
          <id>nexus</id>
          <url>http://<Nexus_VM_IP>:8081/repository/maven-public/</url> <!-- Group Repo URL -->
          <releases><enabled>true</enabled></releases>
          <snapshots><enabled>true</enabled></snapshots>
        </repository>
      </repositories>
      <pluginRepositories>
        <pluginRepository>
          <id>nexus</id>
          <url>http://<Nexus_VM_IP>:8081/repository/maven-public/</url> <!-- Group Repo URL -->
          <releases><enabled>true</enabled></releases>
          <snapshots><enabled>true</enabled></snapshots>
        </pluginRepository>
      </pluginRepositories>
    </profile>
  </profiles>

  <activeProfiles>
    <activeProfile>nexus</activeProfile>
  </activeProfiles>
</settings>
Note: Ensure your project’s pom.xml includes the <distributionManagement> section pointing to your Nexus hosted repository (e.g., my-releases) with the matching server ID (nexus).
8.3 Jenkins Pipeline Script (Jenkinsfile)
Create a new “Pipeline” job in Jenkins and paste the following script into the “Pipeline script” section (or configure it to use “Pipeline script from SCM” if you add a Jenkinsfile to your Git repository).
pipeline {
    agent any // Run on any available Jenkins agent

    environment {
        SCANNER_HOME = tool 'sonar-scanner' // Define SonarQube Scanner tool location
        // Define Nexus credentials as environment variables if needed by settings.xml
        // NEXUS_USER = credentials('nexus-creds-username')
        // NEXUS_PASS = credentials('nexus-creds-password')
        DOCKER_IMAGE_NAME = "jaiswaladi246/boardgame" // Use your Docker Hub username/repo
        DOCKER_IMAGE_TAG = "latest"
    }

    tools {
        jdk 'jdk17'     // Use JDK configured in Jenkins Global Tools as 'jdk17'
        maven 'maven3'   // Use Maven configured as 'maven3'
    }

    stages {
        stage('Git Checkout') {
            steps {
                echo "Checking out code from Git repository..."
                // Use the 'git-cred' ID configured in Jenkins Credentials
                git branch: 'main', credentialsId: 'git-cred', url: 'https://github.com/jaiswaladi246/Boardgame.git' // Replace with your repo URL
            }
        }

        stage('Compile') {
            steps {
                echo "Compiling the Java application..."
                sh "mvn compile"
            }
        }

        stage('Test') {
            steps {
                echo "Running unit tests..."
                sh "mvn test"
            }
        }

        stage('Trivy File system scan') {
            steps {
                echo "Scanning filesystem for vulnerabilities..."
                // Ensure Trivy is installed on the Jenkins agent/server
                sh "trivy fs --format table -o trivy-fs-report.html ."
                // Optional: Archive the report
                // archiveArtifacts artifacts: 'trivy-fs-report.html', allowEmptyArchive: true
            }
        }

        stage('SonarQube Analysis') {
            steps {
                echo "Running SonarQube analysis..."
                // Use SonarQube server configured in Jenkins Manage Jenkins -> Configure System as 'sonar'
                withSonarQubeEnv('sonar') {
                    sh '''
                    $SCANNER_HOME/bin/sonar-scanner \
                      -Dsonar.projectName=BoardGame \
                      -Dsonar.projectKey=BoardGame \
                      -Dsonar.java.binaries=. \
                      -Dsonar.sources=. \
                      -Dsonar.host.url=$SONAR_HOST_URL \
                      -Dsonar.login=$SONAR_AUTH_TOKEN
                    '''
                    // Note: SONAR_HOST_URL and SONAR_AUTH_TOKEN are injected by withSonarQubeEnv
                }
            }
        }

        stage('Quality Gate') {
            steps {
                echo "Checking SonarQube Quality Gate status..."
                script {
                    // Timeout ensures the pipeline doesn't wait indefinitely
                    timeout(time: 1, unit: 'HOURS') {
                        // Use 'sonar-token' ID configured in Jenkins Credentials (Secret Text type)
                        def qg = waitForQualityGate() // Promotes the Quality Gate status to the build result
                        if (qg.status != 'OK') {
                            error "Pipeline aborted due to SonarQube Quality Gate failure: ${qg.status}"
                        } else {
                            echo "SonarQube Quality Gate passed."
                        }
                    }
                }
            }
        }

        stage('Build Package') {
            steps {
                echo "Packaging the application (e.g., JAR/WAR)..."
                sh "mvn package -DskipTests" // Skip tests as they ran already
            }
        }

        stage('Publish Artifacts to Nexus') {
            steps {
                echo "Publishing artifact to Nexus Repository..."
                // Use Maven settings file configured in Jenkins Managed Files with ID 'global-settings'
                // Ensure pom.xml has <distributionManagement> section correctly configured
                withMaven(globalMavenSettingsConfig: 'global-settings', jdk: 'jdk17', maven: 'maven3', mavenSettingsConfig: '', traceability: true) {
                    sh "mvn deploy -DskipTests"
                }
            }
        }

        stage('Build and Tag Docker Image') {
            steps {
                echo "Building Docker image..."
                script {
                    // Use Docker tool configured in Jenkins Global Tools as 'docker'
                    // Use 'docker-cred' ID configured in Jenkins Credentials for registry login (if needed for base image pull)
                    withDockerRegistry(credentialsId: 'docker-cred', toolName: 'docker') {
                         // Ensure Dockerfile exists in the workspace root
                        sh "docker build -t ${DOCKER_IMAGE_NAME}:${DOCKER_IMAGE_TAG} ."
                    }
                }
            }
        }

        stage('Docker Image Scan (Trivy)') {
            steps {
                echo "Scanning Docker image for vulnerabilities..."
                script {
                    // Use 'docker-cred' ID for registry login if the image is private or needs pulling again
                    withDockerRegistry(credentialsId: 'docker-cred', toolName: 'docker') {
                        // Ensure Trivy is installed on the Jenkins agent/server
                        sh "trivy image --format table -o trivy-image-report.html ${DOCKER_IMAGE_NAME}:${DOCKER_IMAGE_TAG}"
                        // Optional: Archive the report
                        archiveArtifacts artifacts: 'trivy-image-report.html', allowEmptyArchive: true
                    }
                }
                // Optional: Add a step to fail the pipeline based on Trivy results
                // sh "trivy image --exit-code 1 --severity CRITICAL ${DOCKER_IMAGE_NAME}:${DOCKER_IMAGE_TAG}"
            }
        }

        stage('Push Docker Image') {
            steps {
                echo "Pushing Docker image to registry..."
                script {
                    // Use 'docker-cred' ID for registry login
                    withDockerRegistry(credentialsId: 'docker-cred', toolName: 'docker') {
                        sh "docker push ${DOCKER_IMAGE_NAME}:${DOCKER_IMAGE_TAG}"
                    }
                }
            }
        }

        stage('Deploy to Kubernetes') {
            steps {
                echo "Deploying application to Kubernetes cluster..."
                // Use Kubernetes config file credential with ID 'k8-cred'
                // Ensure deployment-service.yaml exists in the workspace root
                withKubeConfig(caCertificate: '', clusterName: '', contextName: '', credentialsId: 'k8-cred', namespace: 'webapps', restrictKubeConfigAccess: false, serverUrl: '') {
                    // Note: serverUrl, clusterName etc. are taken from the kubeconfig file.
                    // Ensure the 'webapps' namespace exists in Kubernetes: kubectl create namespace webapps
                    sh "kubectl apply -f deployment-service.yaml -n webapps"
                    sh "kubectl get pods -n webapps" // Verify deployment status
                    // Optional: Add rollout status check
                    // sh "kubectl rollout status deployment/<your-deployment-name> -n webapps"
                }
            }
        }
    }

    post {
        always {
            script {
                // Send email notification regardless of pipeline status
                def jobName = env.JOB_NAME
                def buildNumber = env.BUILD_NUMBER
                def pipelineStatus = currentBuild.result ?: 'UNKNOWN' // SUCCESS, FAILURE, ABORTED etc.
                def subject = "${jobName} - Build #${buildNumber} - ${pipelineStatus}"
                def body = """
                <h1>${jobName} - Build #${buildNumber}</h1>
                <p><b>Pipeline Status:</b> <font color=\"${pipelineStatus == 'SUCCESS' ? 'green' : 'red'}\">${pipelineStatus}</font></p>
                <p>Check the console output for details: <a href=\"${env.BUILD_URL}\">${env.BUILD_URL}</a></p>
                <p>Trivy image scan report is attached (if generated).</p>
                """

                // Use Email Extension Plugin step
                emailext(
                    subject: subject,
                    body: body,
                    to: 'jaiswaladi246@gmail.com', // Recipient email address
                    // from: 'jenkins@example.com', // Optional: configure in Jenkins system config
                    // replyTo: 'jenkins@example.com', // Optional
                    mimeType: 'text/html',
                    attachmentsPattern: 'trivy-image-report.html' // Attach Trivy report
                )
            }
        }
        // Add more post actions for success, failure, etc. if needed
        // success { echo 'Pipeline successful!' }
        // failure { echo 'Pipeline failed.' }
    }
}
Note: Ensure Trivy is installed on the Jenkins server/agent where the pipeline runs (sudo apt-get install trivy -y after adding its repository, check Trivy documentation for current installation instructions). Also ensure your deployment-service.yaml file exists in the root of your Git repository.
8.4 Pipeline Stages Explanation
Git Checkout: Clones the source code from the specified Git repository using stored credentials.
Compile: Uses Maven (mvn compile) to compile the Java source code.
Test: Uses Maven (mvn test) to run unit tests defined in the project.
Trivy File system scan: Scans the project’s files (including dependencies declared in pom.xml) for known vulnerabilities using Trivy. Generates an HTML report.
SonarQube Analysis: Executes the SonarQube scanner to analyze code quality and security, sending results to the configured SonarQube server.
Quality Gate: Checks the SonarQube Quality Gate status for the project. If the gate fails (e.g., too many critical issues), the pipeline is aborted.
Build Package: Uses Maven (mvn package) to create the distributable artifact (e.g., JAR/WAR).
Publish Artifacts to Nexus: Uses Maven (mvn deploy) and the configured settings.xml to upload the built artifact to the Nexus Repository Manager.
Build and Tag Docker Image: Builds a Docker image using the Dockerfile located in the workspace root and tags it.
Docker Image Scan (Trivy): Scans the built Docker image for OS and application-level vulnerabilities using Trivy. Generates an HTML report.
Push Docker Image: Pushes the tagged Docker image to the configured Docker registry (e.g., Docker Hub or Nexus Docker registry).
Deploy to Kubernetes: Uses kubectl (via the Kubernetes CLI plugin and the provided kubeconfig credential) to apply the deployment-service.yaml manifest to the Kubernetes cluster, deploying the application into the webapps namespace.
Post Actions (always): Executes after the pipeline finishes, regardless of status. Sends an email notification using the Email Extension plugin, summarizing the build status and attaching the Trivy image scan report.
Segment 5: Monitoring Implementation
These steps are executed on the dedicated Monitoring VM.
9.1 Prometheus Setup
Download: Go to the Prometheus Download Page and download the latest stable Prometheus archive for Linux (prometheus-*.linux-amd64.tar.gz).
Extract:
wget <URL_to_Prometheus_tar.gz>
tar xvfz prometheus-*.linux-amd64.tar.gz
cd prometheus-*/
Run:
./prometheus --config.file=prometheus.yml &
# The '&' runs it in the background. For production, run as a systemd service.
Access: Open http://<Monitoring_VM_IP>:9090 in your browser.
9.2 Blackbox Exporter Setup
Download: From the Prometheus Download Page, download the Blackbox Exporter for Linux (blackbox_exporter-*.linux-amd64.tar.gz).
Extract:
wget <URL_to_Blackbox_Exporter_tar.gz>
tar xvfz blackbox_exporter-*.linux-amd64.tar.gz
cd blackbox_exporter-*/
Run:
./blackbox_exporter &
# Runs on default port 9115. Configure via blackbox.yml if needed.
# For production, run as a systemd service.
9.3 Grafana Setup
Install: Use the provided script or follow official documentation.
# Install dependencies
sudo apt-get update
sudo apt-get install -y adduser libfontconfig1 musl

# Download Grafana package (check download page for latest version)
wget https://dl.grafana.com/enterprise/release/grafana-enterprise_10.4.2_amd64.deb
# Or OSS version: wget https://dl.grafana.com/oss/release/grafana_10.4.2_amd64.deb

# Install Grafana
sudo dpkg -i grafana-*.deb

# Reload systemd, enable and start Grafana service
sudo systemctl daemon-reload
sudo systemctl enable grafana-server
sudo systemctl start grafana-server
# sudo systemctl status grafana-server # Check status
Access: Open http://<Monitoring_VM_IP>:3000 in your browser. Default login is admin/admin. You’ll be prompted to change the password.
9.4 Configure Prometheus (prometheus.yml)
Edit the prometheus.yml file in the Prometheus directory to add targets, including the Blackbox exporter for probing HTTP endpoints.
global:
  scrape_interval: 15s # Default scrape interval

scrape_configs:
  # Scrape Prometheus itself
  - job_name: 'prometheus'
    static_configs:
      - targets: ['localhost:9090']

  # Scrape Node Exporter (if installed on nodes)
  # Assuming Node Exporter runs on port 9100 on k8s nodes and Monitoring server
  # - job_name: 'node_exporter'
  #   static_configs:
  #     - targets:
  #         - '<Master_Node_IP>:9100'
  #         - '<Worker_Node1_IP>:9100'
  #         - '<Worker_Node2_IP>:9100'
  #         - 'localhost:9100' # If running on Monitoring server too

  # Scrape Blackbox Exporter for probing endpoints
  - job_name: 'blackbox_http' # Probe HTTP endpoints
    metrics_path: /probe
    params:
      module: [http_2xx] # Use the http_2xx module defined in blackbox.yml (default)
    static_configs:
      - targets:
        # Add the URLs of the services deployed in Kubernetes
        - http://<Your_App_NodePort_URL> # e.g., http://<WorkerNodeIP>:<NodePort>
        # Add other internal/external URLs to monitor
        - https://github.com
        - http://<Jenkins_VM_IP>:8080
        - http://<SonarQube_VM_IP>:9000
        - http://<Nexus_VM_IP>:8081
    relabel_configs:
      - source_labels: [__address__]
        target_label: __param_target # The endpoint to probe
      - source_labels: [__param_target]
        target_label: instance # Sets the 'instance' label to the probed endpoint
      - target_label: __address__
        # Address of the Blackbox exporter instance
        replacement: 127.0.0.1:9115 # Use localhost as it's running on the same VM

  # Add Kubernetes service discovery or static configs for Kubelet, API Server, etc.
  # Example for Kubelets (requires appropriate roles/permissions)
  # - job_name: 'kubernetes-kubelet'
  #   kubernetes_sd_configs:
  #     - role: node
  #   scheme: https
  #   tls_config:
  #     ca_file: /var/run/secrets/kubernetes.io/serviceaccount/ca.crt
  #     insecure_skip_verify: true # Use proper cert verification in production
  #   bearer_token_file: /var/run/secrets/kubernetes.io/serviceaccount/token
  #   relabel_configs:
  #     - action: labelmap
  #       regex: __meta_kubernetes_node_label_(.+)
  #     - target_label: __address__
  #       replacement: kubernetes.default.svc:443
  #     - source_labels: [__meta_kubernetes_node_name]
  #       regex: (.+)
  #       target_label: __metrics_path__
  #       replacement: /api/v1/nodes/${1}/proxy/metrics
Modify <Your_App_NodePort_URL> and other IPs/URLs as needed.
Restart Prometheus:
Find the process ID (pgrep prometheus) and kill it (kill <PID>), then restart it (./prometheus –config.file=prometheus.yml &).
9.5 Configure Grafana
Login: Access Grafana at http://<Monitoring_VM_IP>:3000.
Add Data Source:
Go to Configuration (gear icon) -> Data Sources.
Click “Add data source”.
Select “Prometheus”.
Set the URL to your Prometheus server: http://localhost:9090 (since Grafana and Prometheus are on the same VM).
Adjust other settings if needed (e.g., Authentication).
Click “Save & Test”. You should see a “Data source is working” message.
Import Dashboards:
Go to Dashboards (four squares icon) -> Browse -> Import.
You can import dashboards by ID from Grafana.com or upload JSON files. Good starting dashboards include:
Node Exporter Full: (e.g., ID 1860) for system metrics (if Node Exporter is installed).
Kubernetes Cluster Monitoring (via Prometheus): (e.g., ID 3119 or search for others) for Kubernetes metrics.
Blackbox Exporter: (e.g., ID 7587) for probe results.
When importing, select your configured Prometheus data source.
Segment 6: Results & Verification
(This section would typically contain screenshots of the actual running system.)
10.1 Jenkins Pipeline Execution
(Placeholder for a screenshot of a successful Jenkins pipeline run, showing green stages.)
Description: A screenshot showing the Jenkins job view with all stages successfully completed (green). This visually confirms the automation flow from code checkout to deployment.
10.2 Prometheus Targets
(Placeholder for a screenshot of the Prometheus Targets page (Status -> Targets).)
Description: A screenshot from the Prometheus UI (http://<Monitoring_VM_IP>:9090/targets) showing the status of configured scrape targets (prometheus, blackbox_http, node_exporter, kubernetes components). All targets should ideally be ‘UP’.
10.3 Blackbox Exporter Probes
(Placeholder for a screenshot of a Grafana dashboard or Prometheus query showing Blackbox probe success.)
Description: A graph or status panel (likely in Grafana using the Blackbox dashboard or a custom query like probe_success) showing that the configured endpoints (Application URL, Jenkins, SonarQube, Nexus) are being successfully probed (probe_success == 1).
10.4 Grafana Dashboard
(Placeholder for a screenshot of a relevant Grafana dashboard, e.g., Kubernetes cluster overview or Node Exporter dashboard.)
Description: A screenshot displaying a Grafana dashboard visualizing key metrics like cluster CPU/memory usage, node health, pod status, or application-specific metrics if configured. This demonstrates the monitoring capabilities.
10.5 Deployed Application Verification
(Placeholder for a screenshot of the Java application accessed via its Kubernetes service URL/NodePort.)
Description: A screenshot showing the web interface or output of the deployed Java application, accessed through its Kubernetes service endpoint (e.g., http://<WorkerNodeIP>:<NodePort>). This confirms the successful deployment and accessibility of the application.
11. Conclusion
The successful implementation of this DevOps CI/CD pipeline project marks a significant milestone in enhancing the efficiency, reliability, and quality of software delivery processes for the target Java application. By automating key aspects of the software development lifecycle—including compilation, testing, static analysis, security scanning, artifact management, containerization, deployment to Kubernetes, and comprehensive monitoring—the project has enabled rapid and consistent delivery of software releases. This automation contributes directly to improved time-to-market, reduced manual errors, better code quality through integrated checks (SonarQube, Trivy), and increased confidence in deployments. The integration of monitoring tools like Prometheus and Grafana provides essential visibility into the application and infrastructure health post-deployment.
12. Acknowledgment of Contributions
I want to express my gratitude to DevOps Shack for their excellent project concept and implementation guide, which served as a valuable foundation for this documentation and setup.
13. References
Jenkins Documentation:https://www.jenkins.io/doc/
Maven Documentation:https://maven.apache.org/guides/index.html
SonarQube Documentation:https://docs.sonarqube.org/latest/
Trivy Documentation:Trivy
Nexus Repository Manager Documentation:https://help.sonatype.com/repomanager3
Docker Documentation:https://docs.docker.com/
Kubernetes Documentation:https://kubernetes.io/docs/
Kubeadm Documentation:https://kubernetes.io/docs/reference/setup-tools/kubeadm/
CRI-O Documentation:https://cri-o.io/
Calico Documentation:https://docs.tigera.io/calico/latest/about/
Prometheus Documentation:https://prometheus.io/docs/
Grafana Documentation:https://grafana.com/docs/
AWS EC2 Documentation:https://docs.aws.amazon.com/ec2/
For more information about job notifications, Open source Projects, Tech updates stay tuned TechCareerHubs official website.